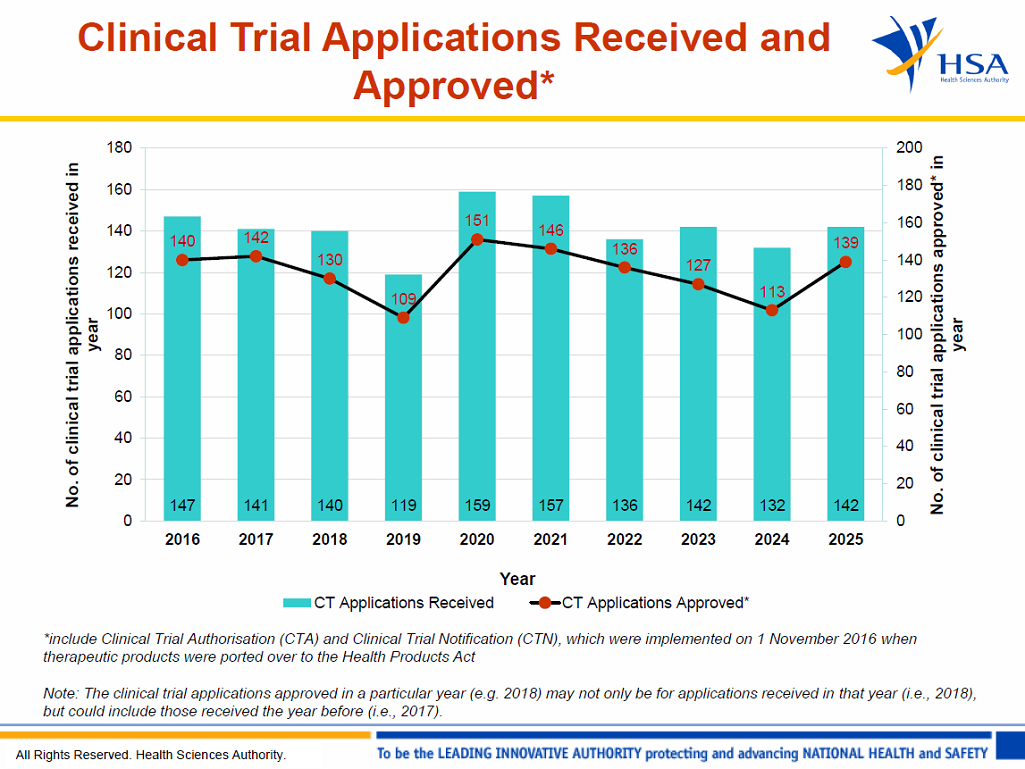
Received and Approved Clinical Trials
Click on the image to download the annual statistics for clinical trials received and approved from 2008 to 2023:
![](/images/default-source/ioctb/stats01_12apr24.png?sfvrsn=6161cb15_2)
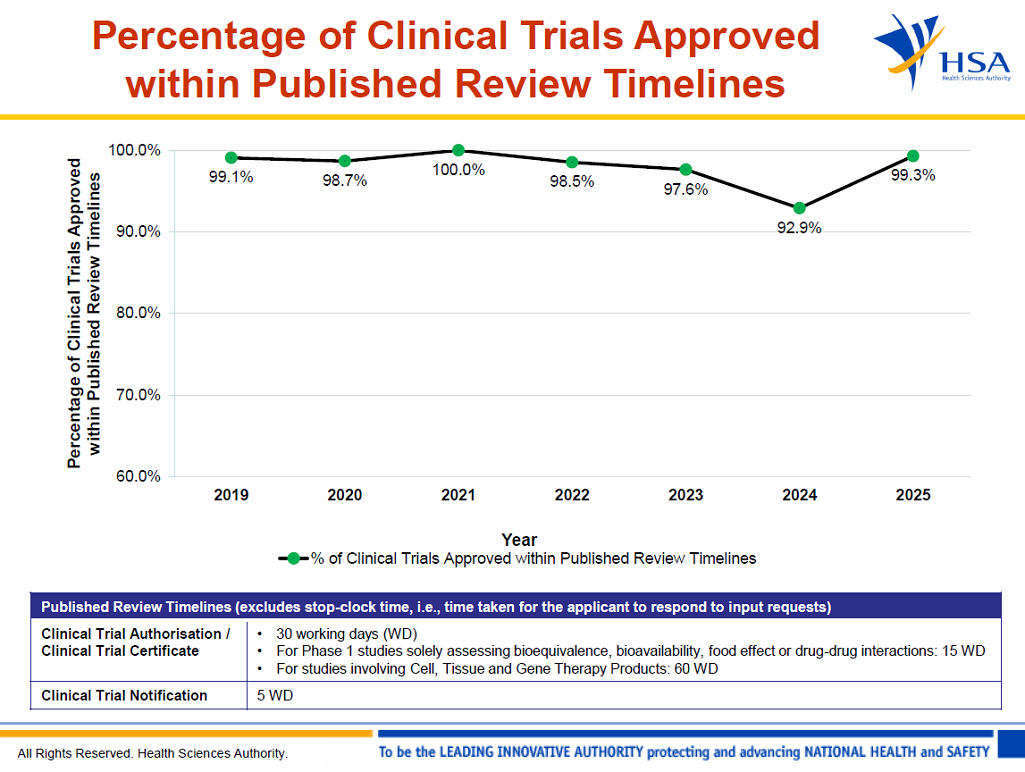
Clinical Trial Review Performance
Click on the image to download the annual statistics for clinical trial review performance from 2018 to 2023:
![](/images/default-source/ioctb/stats05_12apr24.png?sfvrsn=6d1794b0_1)
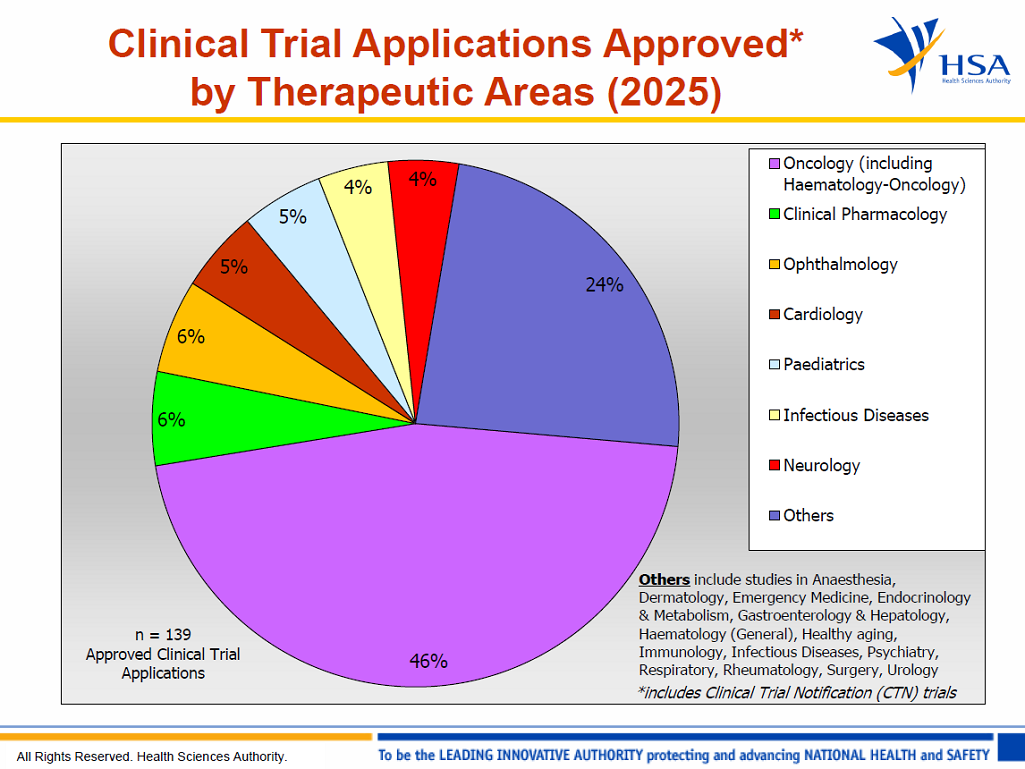
Approved Clinical Trials by Therapeutic Areas
Click on the image to download the therapeutic area pie chart for clinical trials approved in 2023:
![](/images/default-source/ioctb/stats02_12apr24.png?sfvrsn=270f4785_1)
Download the therapeutic area pie charts for 2010 to 2022:
Comparing Number of Clinical Trial Certificates Issued to Approved Clinical Trials
As the annual statistics were previously provided using the number of Clinical Trial Certificates issued, we have provided a similar breakdown using the number of approved trials for comparison.
Click on the image to download the table:
![Comparison for number of CTCs vs approved clinical trials Comparison for number of CTCs vs approved clinical trials](/images/default-source/ioctb/stats0496a06c7a81284080b15cfbbf2e6da0c5.png?sfvrsn=1b8f78c3_2)